Intelligence summary
Intelligence summary is to show the key performance data for the overall application on one page, including the following: application server response time, Apdex metrics, error rate, most time consuming Web application process, throughput, CPU usage, physical memory, slow application process tracing list, server resource list and recent events.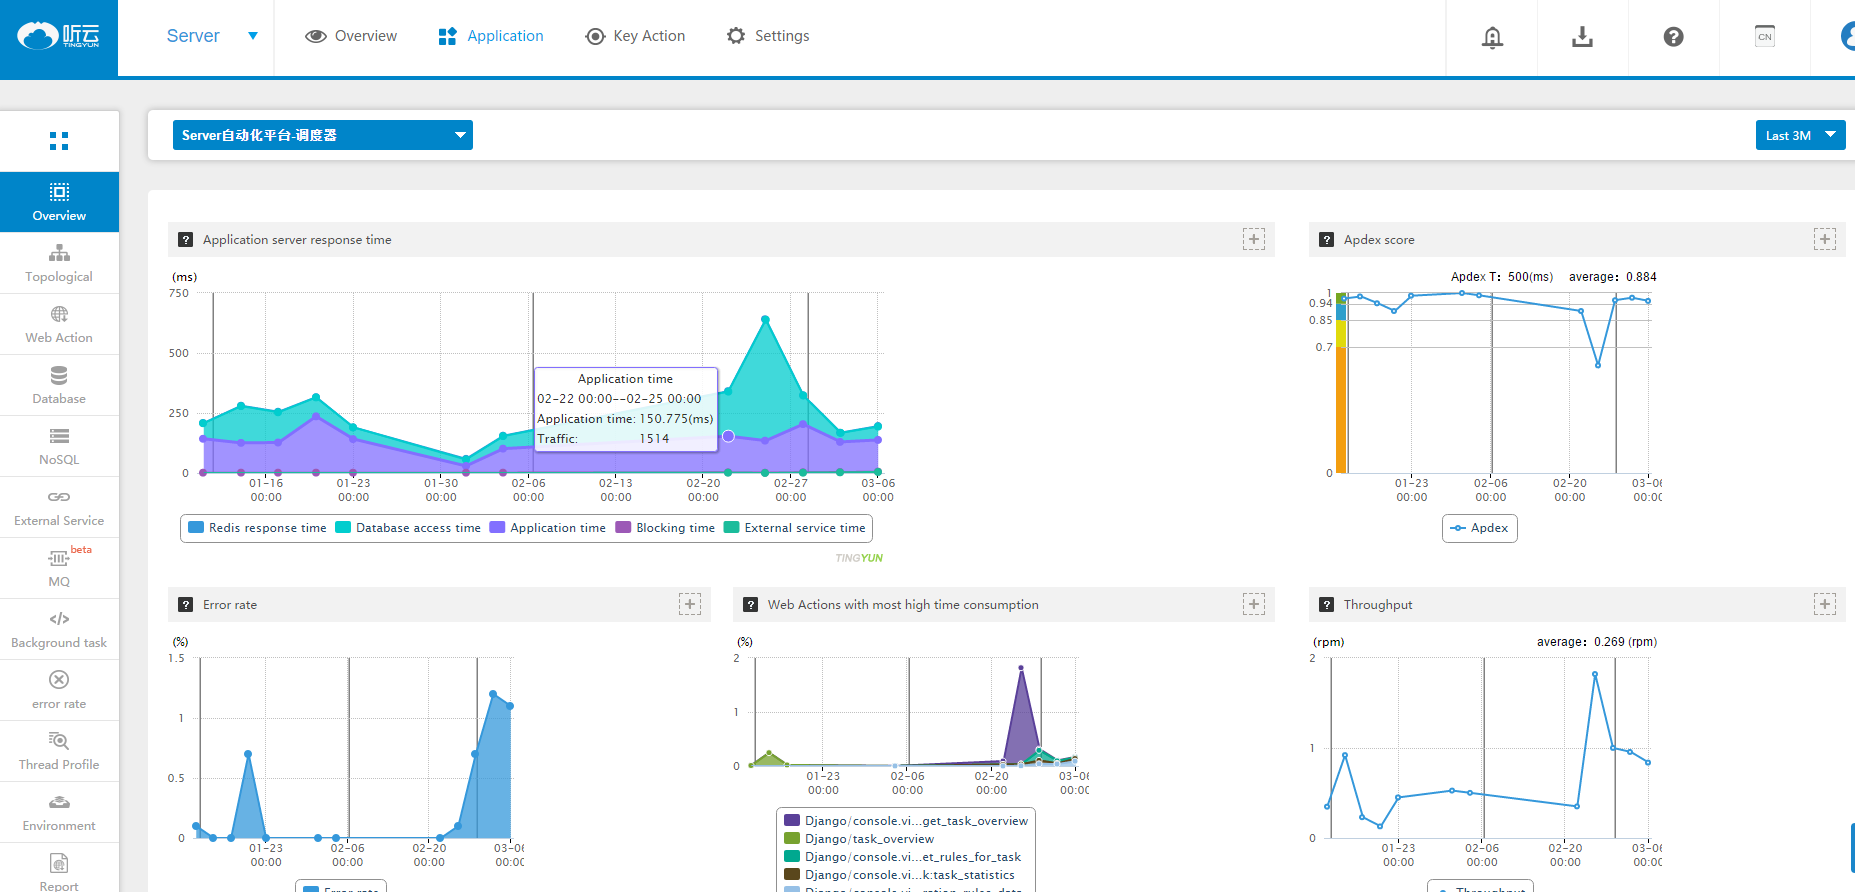
1. Chart Drill
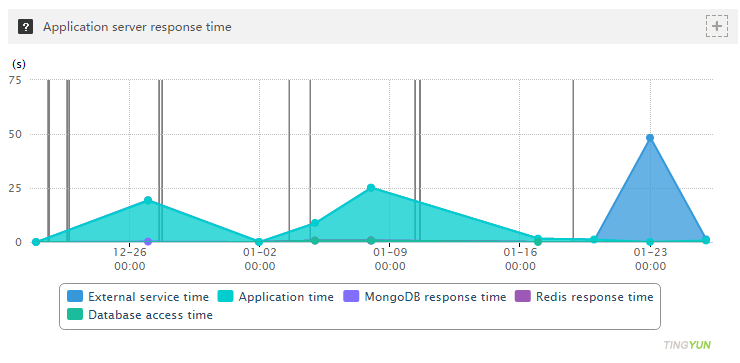
In the application server response time, Apdex metric, error rate, the most time-consuming Web application process, throughput, application CPU usage, application memory usage chart, click on the data point or line to view its detailed data, which applies CPU usage , the application memory usage chart is only valid for java application to jump.
2. Server resource list drill
In the list of server resources, select an “Apdex" of an instance to see the list of Web application processes of the application, which is sorted by Apdex.
