How to generate a report by steps?
1)In the “Task Selection” area, select the task you want to view. You can choose more than one choice.
2)In the “Report Selection” area, click the type of report you want to view.
3) In the “Conditions” area, select the parameters that you want to customize.
4) Confirm the selection is correct, click “Generate A Report” to view the report.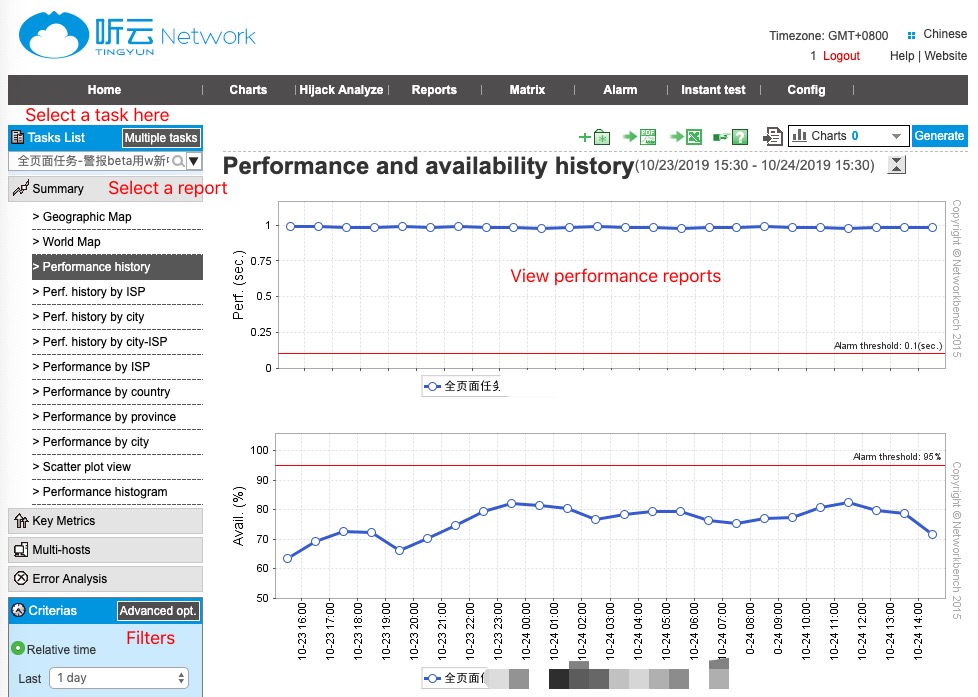
How to quickly view the monitoring data?
To view the data from the same task, you can customize to collect the report. Click the Favorite report icon “Custom” to start customizing the favorite report. Click to show:
Why disable or expired tasks can not to find?
When you select more tasks, the default is no longer show disabled or expired tasks. Cancel the check mark bottom left to show the corresponding task.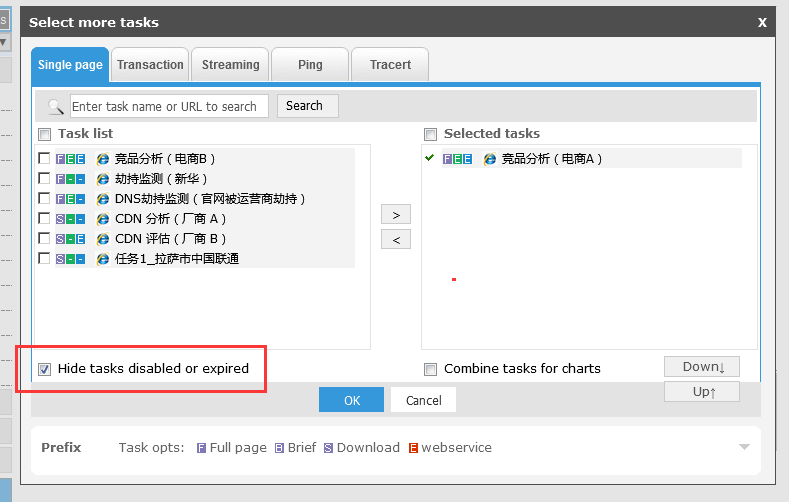
How to adjust the time granularity of the monitoring data?
Click the “Advanced Options”, find the time granularity option, depending on the time range selected by the user, the system will automatically default a time intervals for statistical data. The user can also manually select the time granularity option to change the automatically generated time interval for viewing a curve with a smaller or slightly larger time interval. However, when the selected time granularity does not match the time range, the system automatically adjusts this value.
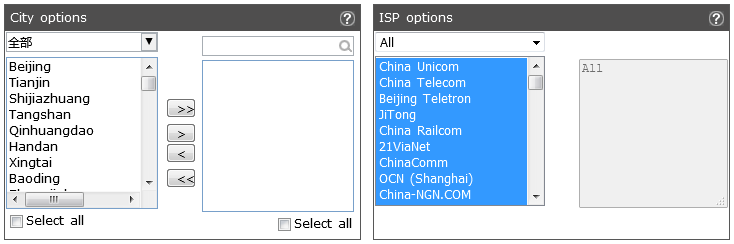
How to filter the monitoring cities and carriers?
Click “Advanced Options”, find the city and carrier option, select the corresponding city and operators and move it to the right, click Save to filter. Hold down the Ctrl to select more than one option.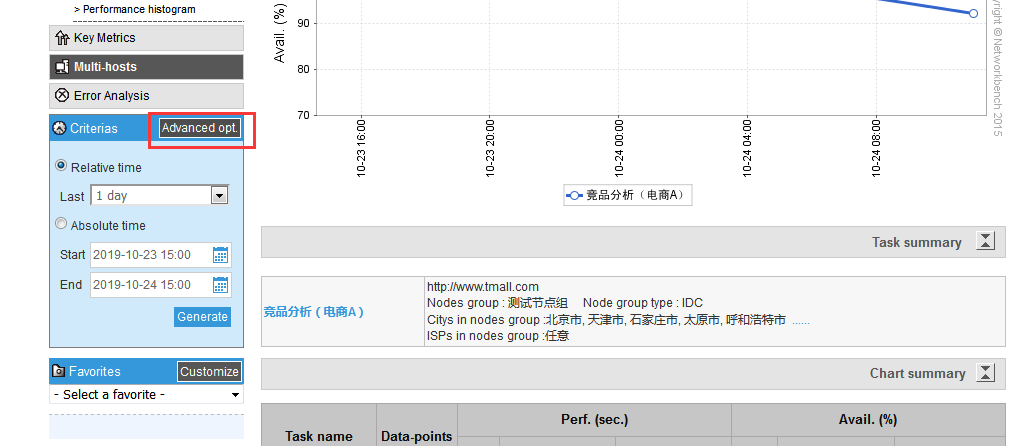
How to filter out noisy data?
Click the “Advanced Options”, find the filter by performance. Status is close, automatic or manual. Automatic filtering includes two filtering methods, by overall and by chart dimensions. Please note it is only valid for the data within one week of time range. If all data under this account needs to be filtered, you can set it in the Control Panel - Exclude Data.
• By overall: Unified Compute the data in the selected time period, exclude by selected proportion.
• By chart dimensions: Separately exclude different kinds of data displayed in graph by proportion. For example, if the current graph shows the carrier dimension, it is filtered separately by each carrier.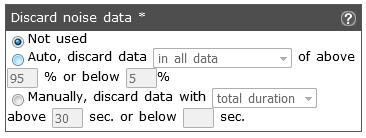
How to exclude part of the monitoring checkpoints data?
Click the “Advanced Options”, find the filter by monitoring node ID or IP. It supports to add by node IP or ID and supports “include” and “exclude”, these two ways to filter. Support multiple monitoring nodes to filter, by line breaks. Please note that it is only valid for data within one week of the time range.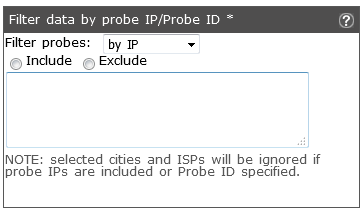
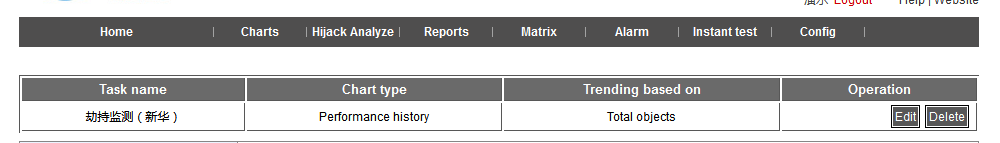
How to quickly generate a data report online?
Select the data graph for the task, add it to the graph pool (you can add multiple charts at the same time), click to generate and export a report.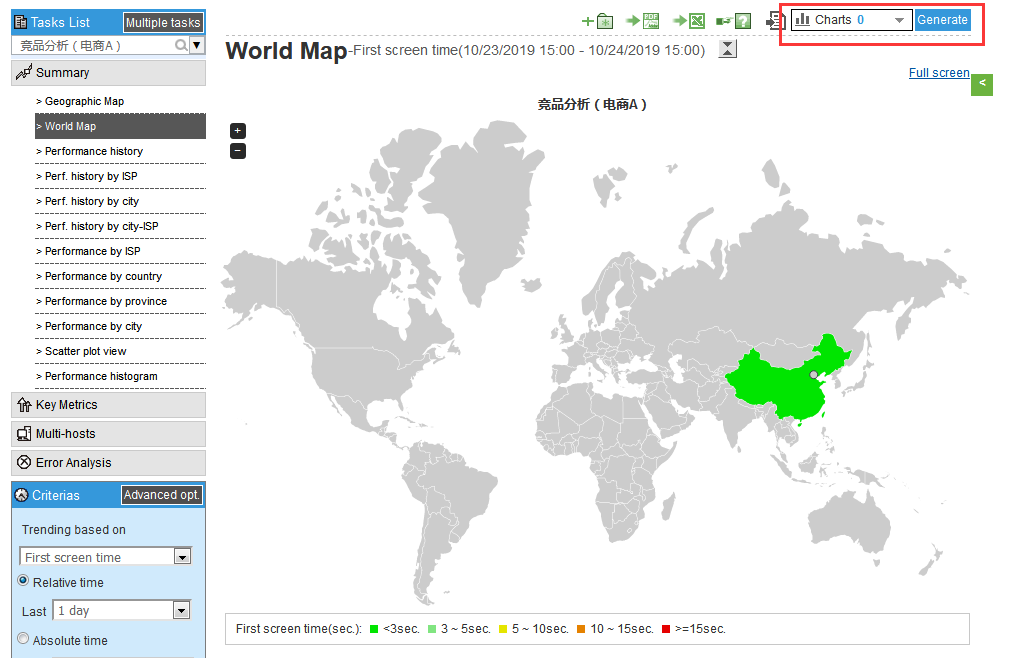
How to set up a scheduled data report?
Click Report - Synthesis Report, select Mail to send the report. Set send plan and receive Email. The report supports to be sent as the message body and attachment.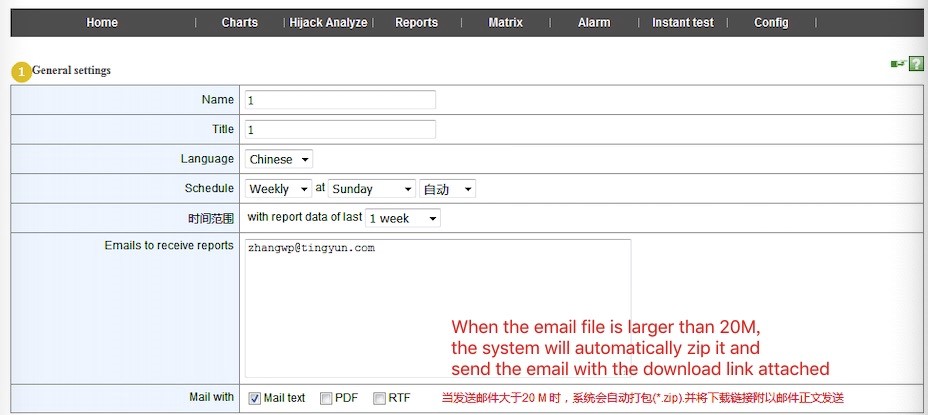
How to improve the accuracy and timeliness of alerts?
Select Alert - Performance Alert Settings, set alert parameters, mailboxes, and cell phones in the New Alerts page. Among them, performance and availability can trigger an alert, setting a reasonable threshold for improving the accuracy of the alarm is very important. Reasonably set the sampling interval, trigger the minimum number of monitoring nodes, automatic filtering conditions are equally important.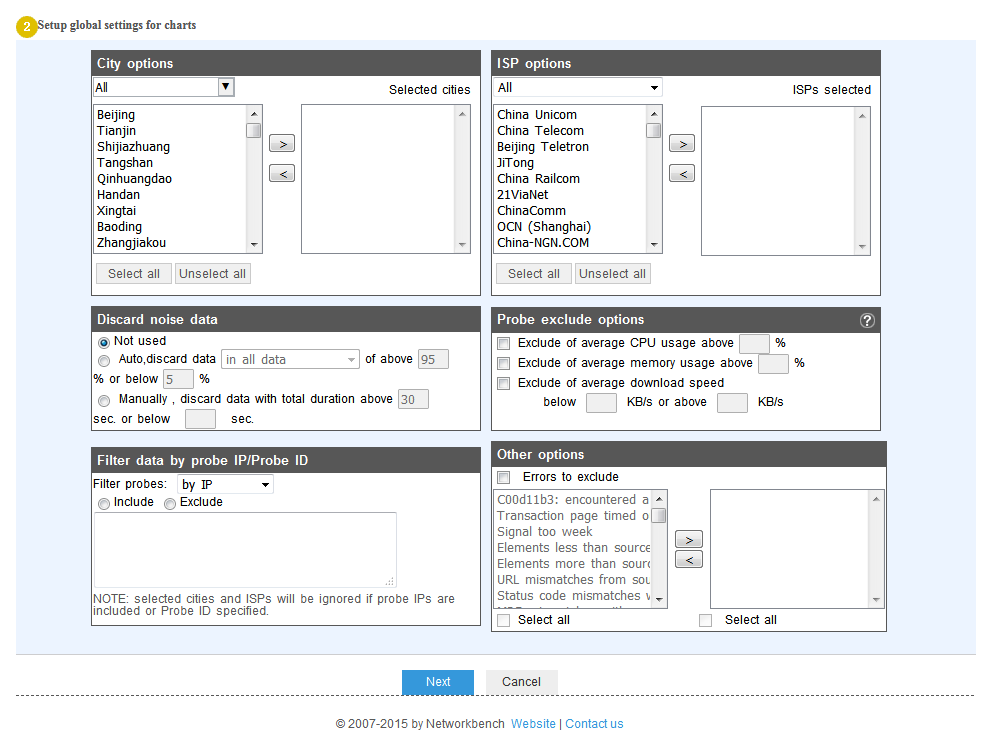
The sampling interval is the time range of the alert sample data. As shown in the alert sample window, the sample window will be translated backward as the alarm execution frequency, and the mean value of the sample data in the current sampling interval is continuously calculated. The current alert execution frequency is 2 minutes. The smaller the sampling interval, the better the timeliness of the alert, but also note to consider the number of sample data. Because the more the sampling data, the more accurate the alarm, the sampling interval should be set reasonably according to the number of samples.