Server
Overview
The Server Overview page displays overview information lists and events of all the monitored servers for the current account.
一. The list information includes the following items:
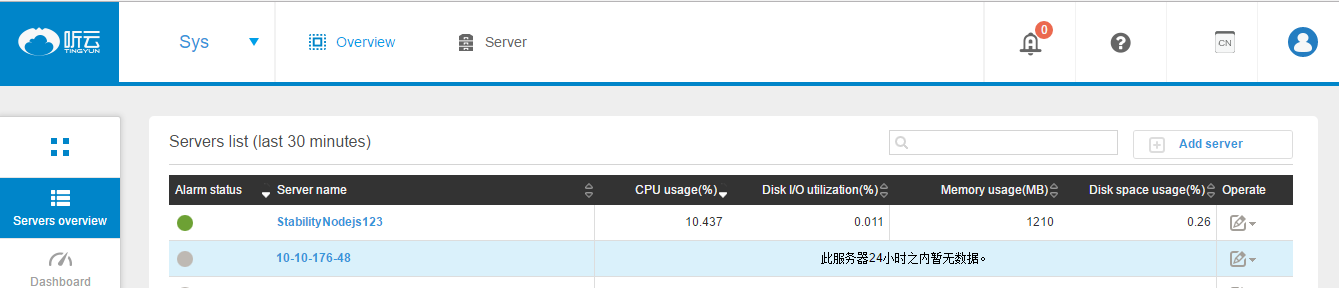
1) Alert status, including four states: normal, warning, critical, no data, respectively, with green, orange, red and gray dots to represent, determined by the application’s performance alert threshold.
2) Server Name: Displays your host name. Click to view the overview page for that server.
3) CPU usage: show the current server CPU usage.
4) Disk I / O utilization: the current server disk I / O utilization, in %.
5) Memory usage: The amount of memory used by the current server, in MB.
6) Hard disk usage.
7) Operation: You can modify the alert threshold, delete and hide the operation of the server.
二. Add a server
In the top right corner of the page click on the Add Server button to jump to server-add-boot page. You need to follow the steps:
1) Download the agent for your system.
2) Click on the appropriate installation package, the following installation guide will appear. As shown below:
3) After installation, you can return to the list to view the data.
三. Event list
The event list shows the following four types of questions:
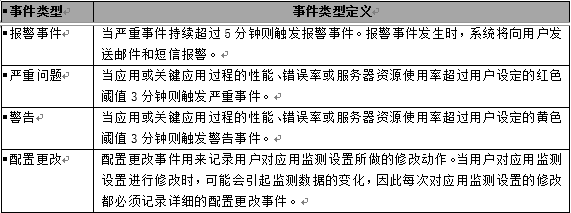
The above events are based on the threshold set by the user in the alert settings. Default settings are as follows:

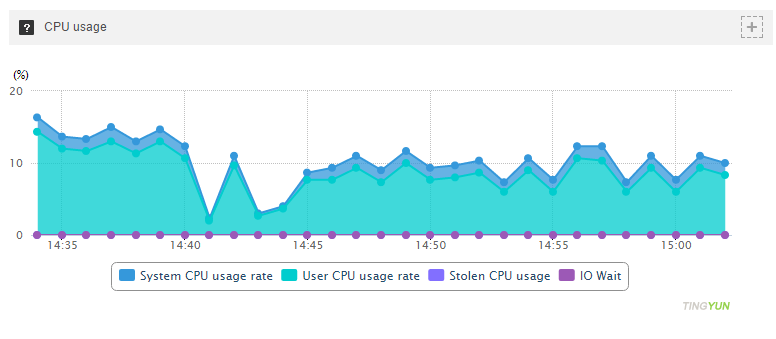
Server Intelligence Summary
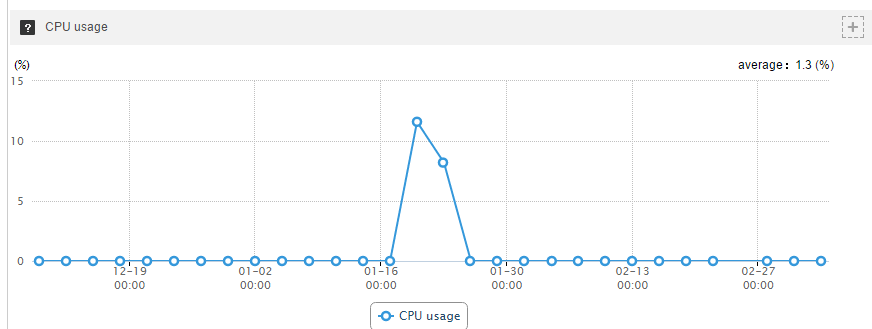
1) CPU usage: displays consumes system, user, and IO wait,these three aspects of CPU utilization in the form of a graph.
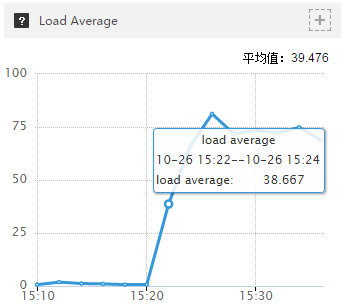
2) Load Average Curve: displays the historical graph of the system load (1-minute Load Average value) over time. Hover displays the value of Load Average for the current point in time.
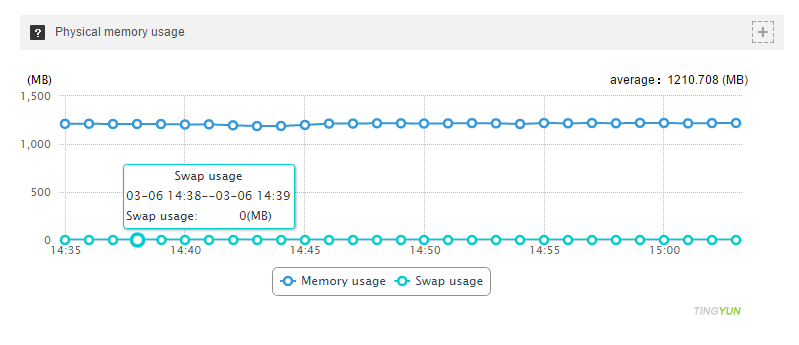
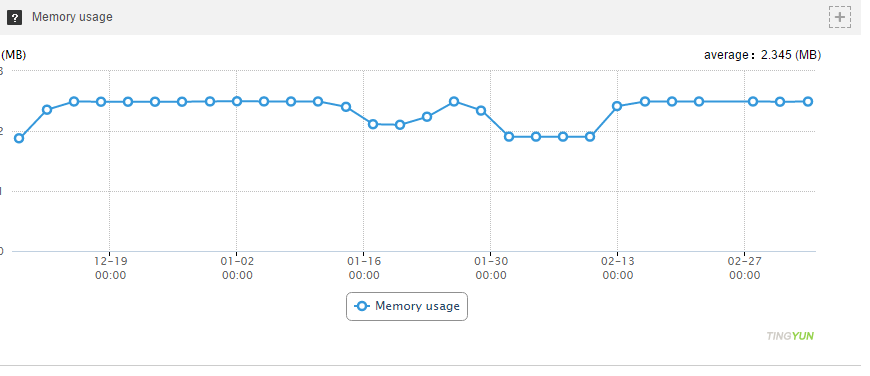
3) Memory Usage: Display the physical memory of the application and the curve of the used Swap with time in the form of a graph.
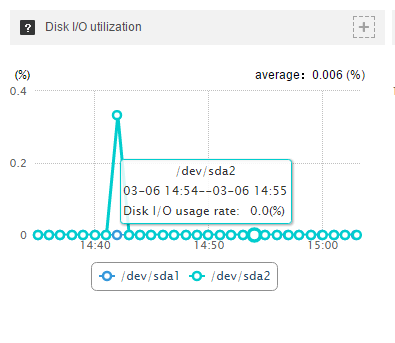
4) Disk IO utilization: Shows the independent IO usage history curve for each disk device and the IO usage history curve for all disk devices in the form of a graph.
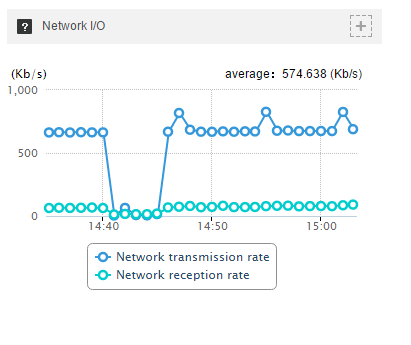
5) Network IO: shows all network equipment data transmission and data reception rate history curve in the form of a graph.
6)Server information
Show all kinds of hardware and software information of the monitored server, including the following information:
a. CPU brand, e.g. Intel (R) Xeon (R) E5320 @ 1.86GHz
b. Number of CPUs, number of physical CPUs, e.g. 4 CPUs
c. Physical memory size, e.g. 2.0 GB
d. Operating system name and version number, e.g. Enterprise Linux Server release 5.1 (Carthage)
e. Operating system kernel version number, e.g. Linux 2.6.18-53.el5 x86_64
f. Server agent version number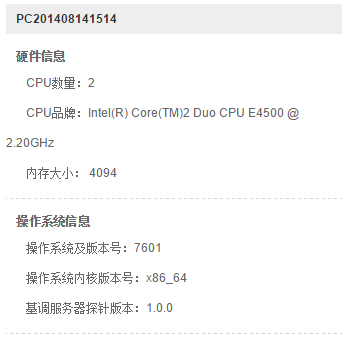
7)Server information
Show recent alert events for the server.
The above events are based on the threshold set by the user in the alert settings. Default settings are as follows:
process
The Process menu displays the performance of various systems and user processes on the monitored servers from multiple dimensions.
一、The server process list: A system or user process list of CPU and memory that appears in the system during the chart period. The list can be sorted by CPU usage and memory usage.
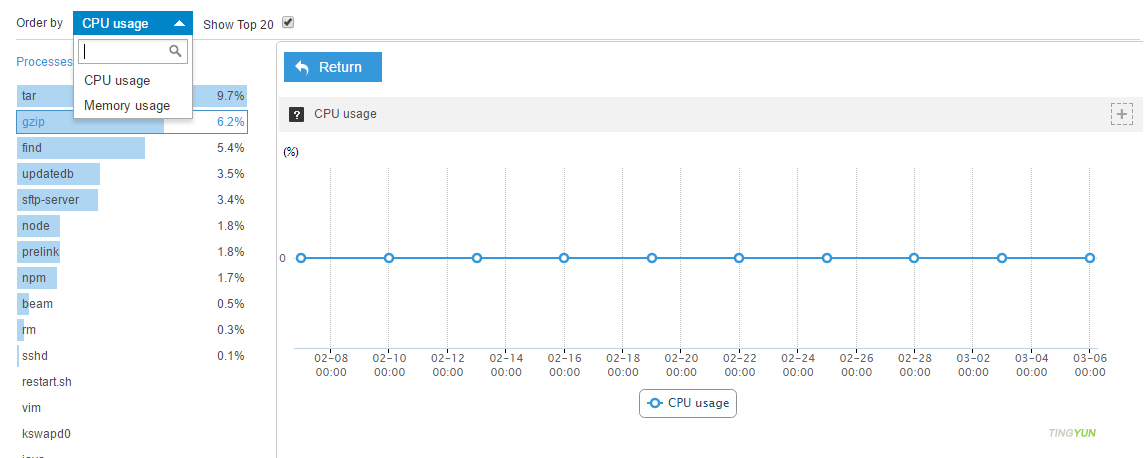
The process list displays the following items:
1)Process Name: The name of the process execution file.
2)CPU Usage: CPU usage of the process.
3)Memory Usage: The process’s physical memory usage.
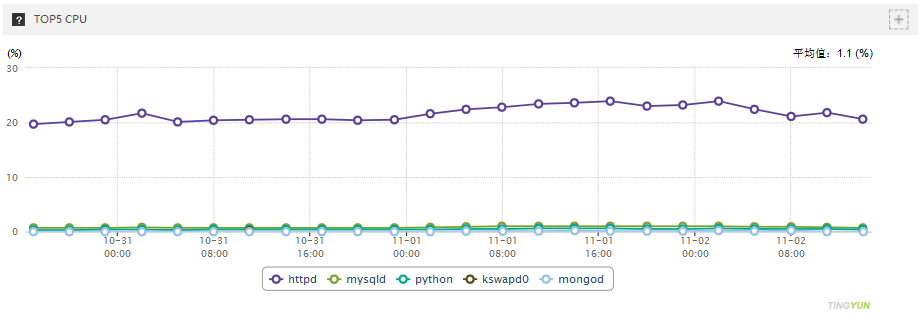
4)CPU Usage Top5: Shows the CPU usage curve of the top 5 highest-performing processes in the process list for the current chart time period.
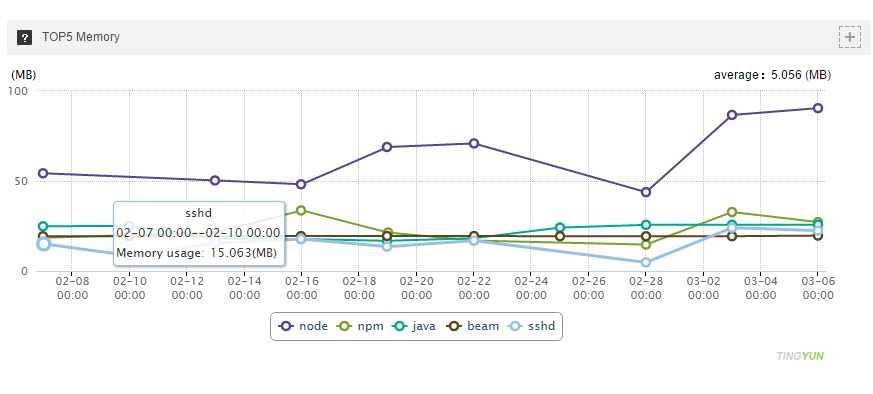
5)Memory Usage Top5: Shows the memory utilization curve of the top 5 most memory-intensive processes in the process list for the current chart time period.
二. Click on the process name, in the right side of the chart shows the history of selected process details, including the following items:
1) CPU Usage: Displays the historical graph of CPU usage for the currently selected process data period.
2) Memory usage history graph, units and overview consistent.
Network
The Network menu displays the usage of network resources on the monitored server.
Network resource information display is divided into left and right parts, The left part shows a summary of all physical or virtual network interfaces in the system as a bar chart icon with text, the right part displays the detailed history data of the currently selected network interface in the form of multiple curve charts.
一. Overview information includes:
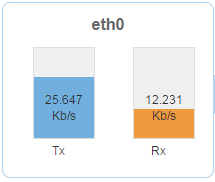
1) network interface name: eth0, bond0, etc.
2) Data transmission rate (Tx) Bar graph and its rate. The data transmission rate bar chart draws the height of the chart with a nominal transfer rate of 100% for the network port.
3) Data reception rate (Rx) Bar graph and its rate. The data reception rate bar chart draws the height of the chart with a nominal transfer rate of 100% for the network port.
二. Click on the network interface overview icon, the right side shows the history data curve of each performance indicator of the selected network interface, including the following information:
1) Network interface name.
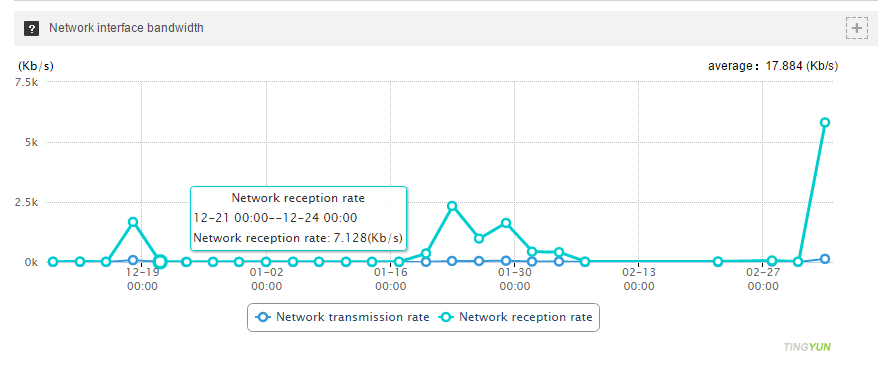
2) Network Interface Bandwidth: The area graphs of the read / write (Tx, Rx) rate of the network interface,plotted in two colors.
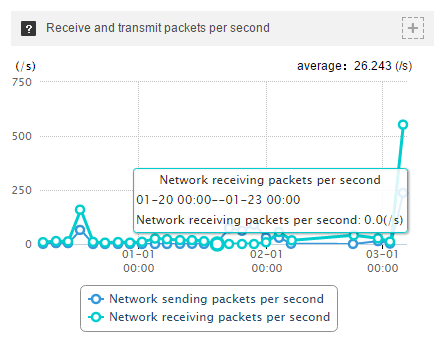
3) Send and receive data packets per second(pps):The graph of network interface to send and receive packets per second.
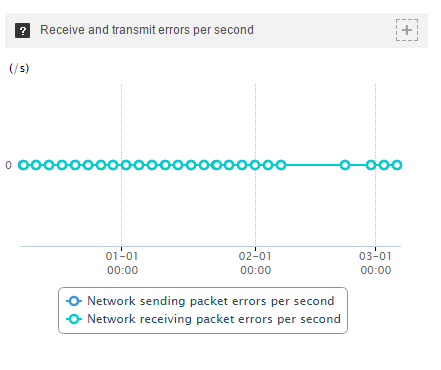
4) Send and receive errors per second: The graph of network interface to send and receive errors per second.
Disk
The Disk menu displays the usage of hard disk resources on the monitored server. Hard disk information displays in two parts, the left part shows an overview of the disk partitions that are mapped in the system as a list of dynamic pie chart icons with text, The right part shows the detailed history data of the currently selected disk partition in the form of multiple curve charts(the first disk partition selected by default).
一. Overview information includes:
1) mapping path names, e.g. /usr, /boot.
2) Pie chart shows the percentage of usage of the partition.
3) The text shows the total size of the partition space and the amount of space used.
4) The pie chart shows the IO utilization percentage of the partition.
5) The text shows the percentage of read and write IO usage of the partition.
二. Click the disk partition overview icon, the right side shows the history curve of each indicator of the partition, including the following information:
1) The mapping path name of the hard disk partition
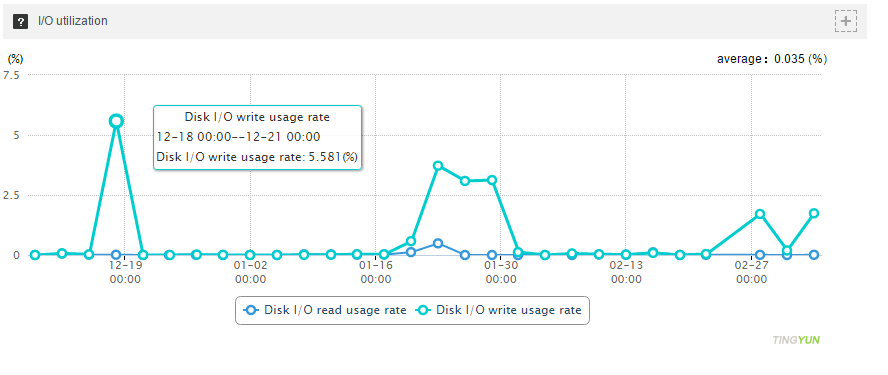
2) IO usage: displays the historical usage curve of I/O reads and I/O writes.
3) disk operand: Use two curves to display I/O reads and I/O writes per second operand data.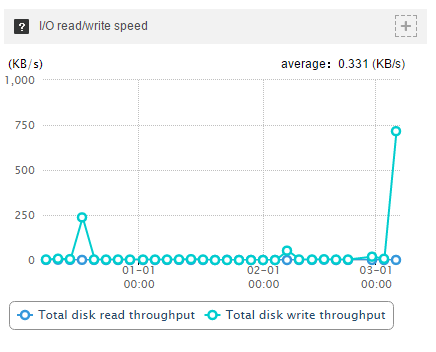
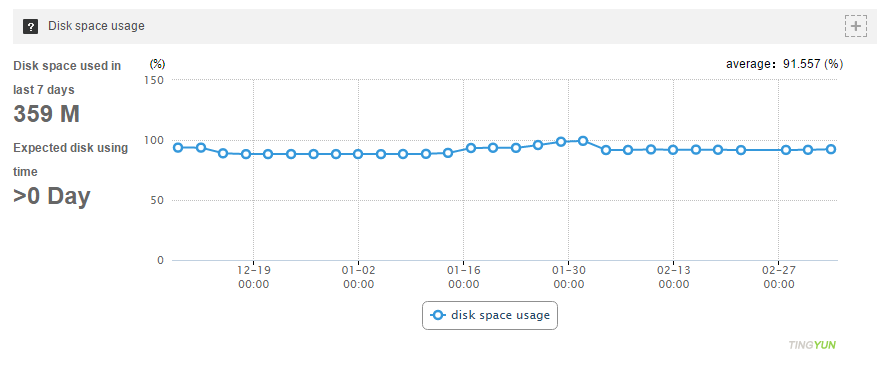
4) Disk space usage: Displays historical graphs of the current hard disk partition usage in the form of a zone map and displays the following two statistics: 7-day disk usage (7-day increase or decrease in space); an estimated time of space utilization reaches 100%.
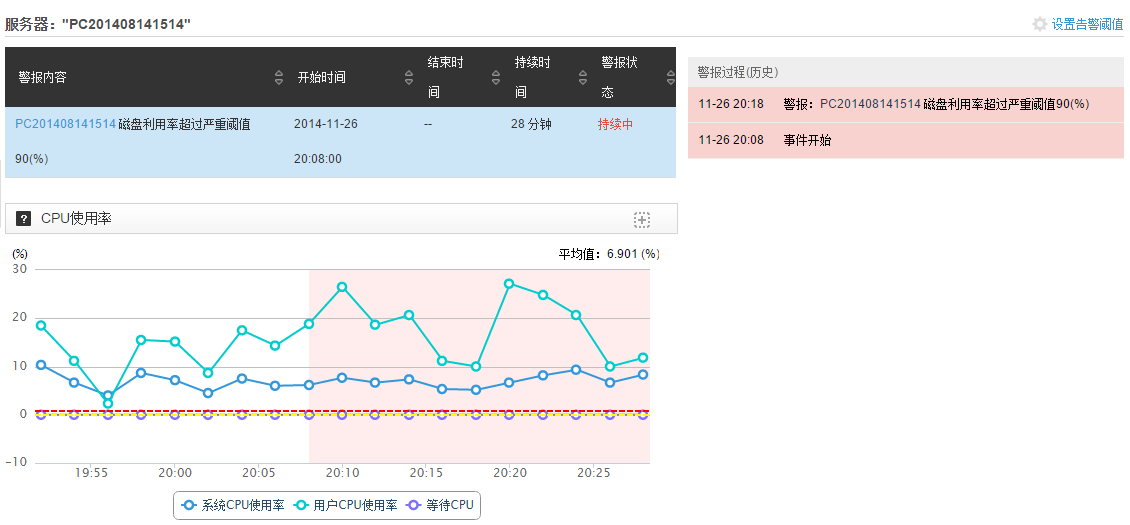
Server alerts
The page shows the alert list of the current server.
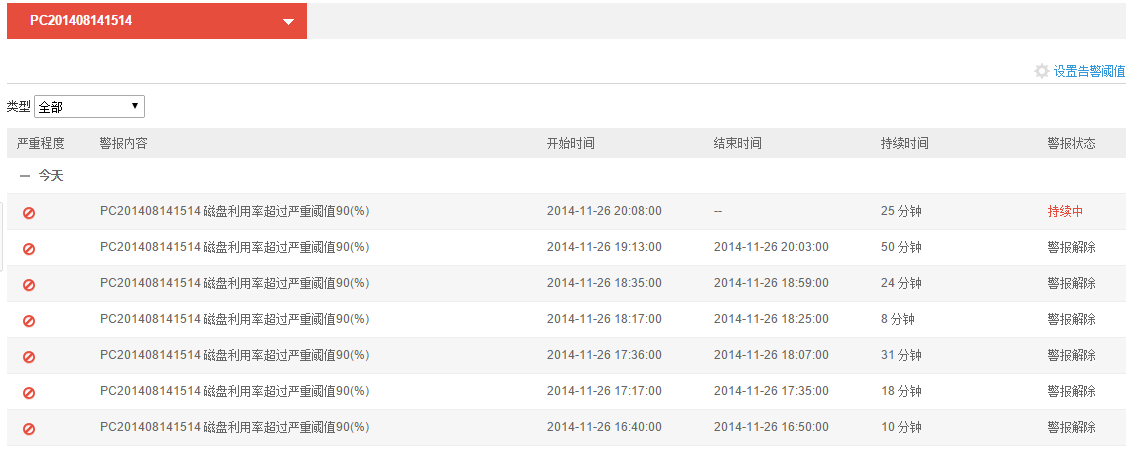
1) The drop-down menu allows you to switch the server which the currently displayed alert event belongs to.
2) Click “Set Alert Threshold” on the right to set the alert threshold.
3) Click the alert content to view the alert details page, the page displays error details, the alert process, and CPU usage, memory usage, and disk IO details for the error. As shown below: